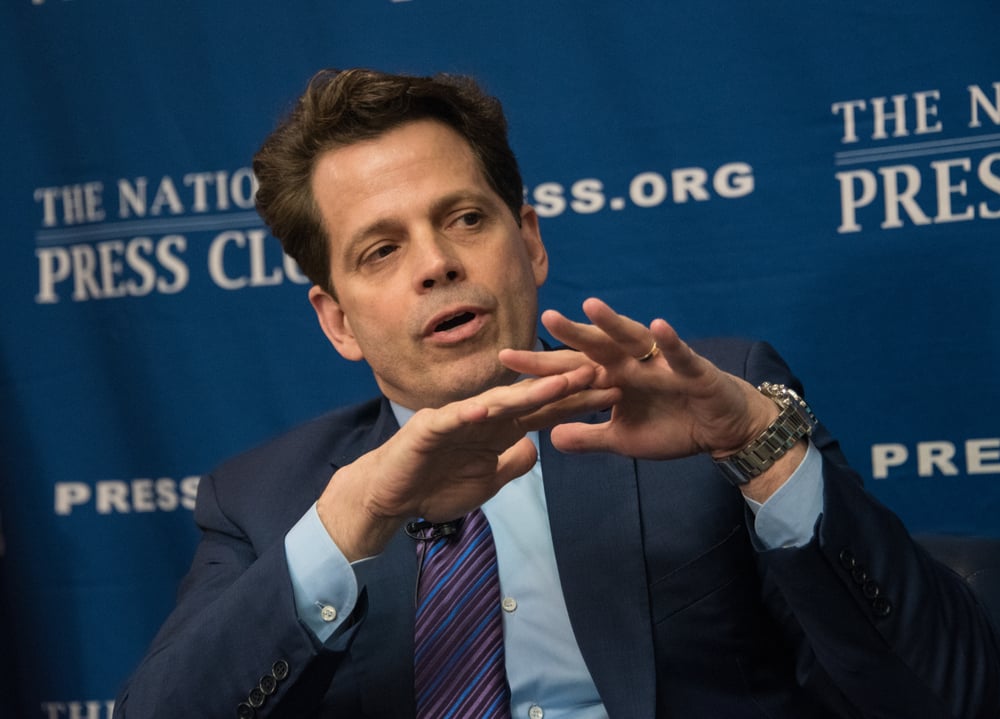
By now, you’re well aware of how to find trends using simple moving averages, such as the 50- and 200-day moving averages. But you should also know how to potentially spot when a trend could stop dead in its tracks, or birth a new trend.
Read More
We’re often told to “Never buy a stock hitting a 52-week low.”
“Stocks in downtrends tend to stay in downtrends.”
“Any stock hitting a 52-week low will always be weak.”
Or, “nothing is more destructive to amateur investors than thinking that a stock trading near a 52-week low is a good buy.”
However, none of that is true.
Read More
It was a rare occurrence we hadn’t seen in 24 years.
The infamous fear gauge – the VIX – fell to an unusual low of less than 10 in May 2017 – something that hasn’t happened since December 1993. In the single digits, the idea is that all is well. Calm as resumed. But it’s at these points when smart investors begin to worry.
Read More
It’s not about having the perfect strategy.
It’s about the rule you abide by with each trade.
One of the biggest issues facing all walks of traders is a severe lack of discipline and structure in stock buying habits. Many fail to use stop losses, or even protect gains with a simple trailing stop loss strategy. Others risk far too much.
Read More
Why would I want to touch a stock that just plummeted?”
My answer, “Why not?”
What many traders don’t understand is that many pullbacks create opportunities, especially when it happens to a well-known stock.
Read More
Traders are often told to buy excessive fear or greed.
Unfortunately, many of those traders aren’t aware of when to pull the trigger, or realize when fear or greed have gotten way out of control. Then, when they finally do decide to make the trade, the stock has already begun to pivot.
And more often than not, they miss the profit opportunity.
Read More
One of the best ways to become a great trader is to try new things.
Unfortunately, there’s no such thing as a perfect strategy. But if you’re willing to trade outside of the box, you can become a better trader.
Read More
One of the best ways to make money on the Street is by spotting excessive bouts of fear and greed.
In fact, that’s how some of the most famous investors made their money.
In short, they were buying when others were scared, and selling when others got too greedy. They were exploiting the very psychology of herd mentality.
And we can do much of the same.
Read More
All of a sudden, there’s a gap in the chart of your favorite stock.
Surprise news, earnings, something unexpected caused a bout of extreme optimism or pessimism that resulted in the move.
Look at Palo Alto Networks (PANW), for example. In early June 2017, shares closed at $118.59. However, shortly after the close, news of a massive cyber attack began hitting headlines. Orders come flooding in overnight. The next day, the stock opens at $140.
Read More
We have all heard the phrase, "the trend is your friend" and as traders we also know just how amazing profitable it can be trading alongside it as well as how devastating it can be to out accounts when we trade against it. But before we are truly able to spot likely trend reversals, we must be able to spot a trend itself.
Read More
Once you begin to understand technical analysis, you’re literally looking at a consolidated view of the very forces of supply and demand – the two key forces that drive markets.
We’ve already discussed some of the most powerful and most used patterns, like Bollinger Bands, Fibonacci retracements, relative strength, head and shoulder patterns, breakouts, and even how to use candlesticks.
Read More
Technical analysts attempt to predict direction by studying past price action and charts. And understandably, there are critics. In fact, some see it a pseudo-nonsense.
Forbes for example says it’s fundamentally flawed.
Read More
Fear can destroy a stock in seconds.
But it can also lead to quite a bit of opportunity.
Look at Coca-Cola (KO), for example in late February 2019.
Read More
The Parabolic Stop and Reverse (SAR), commonly known as Parabolic SAR is a trend following indicator that highlights current price direction.
It also provides entry and exit signals as well with dotted lines.
Read More
When it comes to technical analysis, there are thousands of patterns to watch for, decipher and understand along the way.
They’re not so tough to understand.
In fact, one of the easiest ones to understand is the channel, defined as two parallel trend lines within a tight trading range. The upper line connects the price peaks in the channel while the lower line connects the price lows.
Read More
Traders are often told to buy excessive fear or greed.
Unfortunately, many aren’t aware of when to actually pull the trigger, or realize when fear or greed have gotten way out of control.
But there’s a simple way to know exactly when to buy and when to sell.
Read More