Evaluating Broadcom Against Competitors in Semiconductors
In the ever-changing and fiercely competitive business landscape, conducting thorough company analysis is crucial for investors and industry experts. In this article, we will undertake a comprehensive industry comparison, evaluating Broadcom (NASDAQ:AVGO) and its primary competitors in the Semiconductors & Semiconductor Equipment industry. By closely examining key financial metrics, market position, and growth prospects, our aim is to provide valuable insights for investors and shed light on company’s performance within the industry.
Broadcom Background
Broadcom is one of the largest semiconductor companies in the world and has also expanded into infrastructure software. Its semiconductors primarily serve computing and networking, with custom AI accelerators now accounting for the bulk of the business. It is primarily a fabless designer, but holds some manufacturing in-house, such as for its best-of-breed film bulk acoustic resonator filters that sell into the Apple iPhone. In software, it sells virtualization, infrastructure, and security software to large enterprises, financial institutions, and governments. Broadcom is the product of consolidation. Its businesses are an amalgamation of former companies like legacy Broadcom and Avago Technologies in chips, as well as VMware, Brocade, CA Technologies, and Symantec in software.
| Company | P/E | P/B | P/S | ROE | EBITDA (in billions) | Gross Profit (in billions) | Revenue Growth |
|---|---|---|---|---|---|---|---|
| Broadcom Inc | 65.37 | 21.32 | 25.40 | 11.11% | $13.07 | $15.41 | 47.87% |
| NVIDIA Corp | 31.34 | 25.36 | 19.75 | 33.06% | $71.0 | $61.16 | 85.23% |
| Micron Technology Inc | 49.23 | 16.24 | 20.35 | 21.0% | $18.48 | $17.75 | 196.29% |
| Advanced Micro Devices Inc | 170.83 | 12.96 | 22.47 | 2.17% | $2.4 | $5.42 | 37.85% |
| Texas Instruments Inc | 51.60 | 16.37 | 14.94 | 9.35% | $2.42 | $2.8 | 18.58% |
| Marvell Technology Inc | 99.50 | 13.90 | 29.03 | 0.21% | $0.66 | $1.26 | 27.57% |
| Qualcomm Inc | 22.90 | 8.23 | 5.19 | 29.27% | $2.82 | $5.7 | -3.46% |
| Analog Devices Inc | 61.67 | 5.98 | 16.04 | 3.48% | $1.9 | $2.44 | 37.25% |
| NXP Semiconductors NV | 28.51 | 6.89 | 6 | 10.69% | $1.7 | $1.79 | 12.2% |
| Monolithic Power Systems Inc | 103.67 | 19.35 | 23.81 | 5.36% | $0.26 | $0.45 | 26.14% |
| Microchip Technology Inc | 427.77 | 7.93 | 10.89 | 1.79% | $0.39 | $0.8 | 35.11% |
| Credo Technology Group Holding Ltd | 99.33 | 22.53 | 35.15 | 8.64% | $0.17 | $0.3 | 157.02% |
| ON Semiconductor Corp | 83.03 | 6.01 | 7.54 | -0.45% | $0.25 | $0.58 | 4.68% |
| Tower Semiconductor Ltd | 123.68 | 10.08 | 18.76 | 2.2% | $0.15 | $0.11 | 15.48% |
| MACOM Technology Solutions Holdings Inc | 156.22 | 19.76 | 25.91 | 3.34% | $0.07 | $0.16 | 22.5% |
| First Solar Inc | 16.46 | 2.77 | 5.06 | 3.57% | $0.51 | $0.49 | 23.64% |
| Lattice Semiconductor Corp | 998.36 | 25.87 | 33.73 | 3.0% | $0.04 | $0.12 | 42.24% |
| Average | 157.76 | 13.76 | 18.41 | 8.54% | $6.45 | $6.33 | 46.14% |
When closely examining Broadcom, the following trends emerge:
- With a Price to Earnings ratio of 65.37, which is 0.41x less than the industry average, the stock shows potential for growth at a reasonable price, making it an interesting consideration for market participants.
- It could be trading at a premium in relation to its book value, as indicated by its Price to Book ratio of 21.32 which exceeds the industry average by 1.55x.
- The Price to Sales ratio of 25.4, which is 1.38x the industry average, suggests the stock could potentially be overvalued in relation to its sales performance compared to its peers.
- The company has a higher Return on Equity (ROE) of 11.11%, which is 2.57% above the industry average. This suggests efficient use of equity to generate profits and demonstrates profitability and growth potential.
- With higher Earnings Before Interest, Taxes, Depreciation, and Amortization (EBITDA) of $13.07 Billion, which is 2.03x above the industry average, the company demonstrates stronger profitability and robust cash flow generation.
- Compared to its industry, the company has higher gross profit of $15.41 Billion, which indicates 2.43x above the industry average, indicating stronger profitability and higher earnings from its core operations.
- The company’s revenue growth of 47.87% exceeds the industry average of 46.14%, indicating strong sales performance and market outperformance.
Debt To Equity Ratio
The debt-to-equity (D/E) ratio indicates the proportion of debt and equity used by a company to finance its assets and operations.
Considering the debt-to-equity ratio in industry comparisons allows for a concise evaluation of a company’s financial health and risk profile, aiding in informed decision-making.
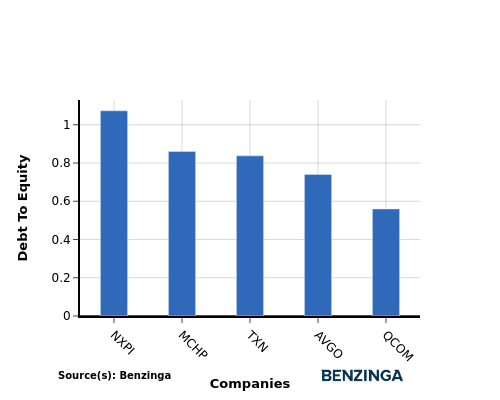
In terms of the Debt-to-Equity ratio, Broadcom stands in comparison with its top 4 peers, leading to the following comparisons:
- When evaluating the debt-to-equity ratio, Broadcom is in the middle position among its top 4 peers.
- The company maintains a moderate level of debt relative to its equity with a debt-to-equity ratio of 0.74, suggesting a relatively balanced financial structure.
Key Takeaways
The PE, PB, and PS ratios for Broadcom indicate that it may be overvalued compared to its peers in the Semiconductors & Semiconductor Equipment industry. However, its high ROE, EBITDA, gross profit, and revenue growth suggest strong financial performance relative to competitors. These metrics highlight Broadcom’s profitability and growth potential within the industry.
This article was generated by Benzinga’s automated content engine and reviewed by an editor.